
主题
本教程演示如何在开启专门的图表解析的情况下解析 PDF,从含图表的那页抽出表格数据,并用 pandas 做基础的数据分析。我们沿用《2024 执行摘要》PDF,即解析 PDF 并理解输出 所用的同一份;它的第三页含有一张 Parse 能转成结构化数据的图表。
1. 准备
把 API key 设成环境变量,SDK 会自动读取:
终端窗口
export LLAMA_CLOUD_API_KEY="llx-..."安装 SDK 并构造一个 client。本例用 pandas 分析解析出的表格,因此 Python 标签页会一并安装它。
- Python
- TypeScript
- Go
- Java
- CLI
终端窗口
pip install "llama-cloud>=2.8" pandasfrom llama_cloud import LlamaCloud
client = LlamaCloud() # reads LLAMA_CLOUD_API_KEY from the environment终端窗口
npm install @llamaindex/llama-cloudimport LlamaCloud from '@llamaindex/llama-cloud';
import fs from 'fs';
const client = new LlamaCloud(); // reads LLAMA_CLOUD_API_KEY from the environment终端窗口
go get github.com/run-llama/llama-parse-goimport llamacloud "github.com/run-llama/llama-parse-go"
client := llamacloud.NewClient() // reads LLAMA_CLOUD_API_KEY from the environmentimplementation("ai.llamaindex:llama-cloud:1.3.0")import ai.llamaindex.llamacloud.client.LlamaCloudClient;
import ai.llamaindex.llamacloud.client.okhttp.LlamaCloudOkHttpClient;
// reads LLAMA_CLOUD_API_KEY from the environment
LlamaCloudClient client = LlamaCloudOkHttpClient.fromEnv();终端窗口
go install github.com/run-llama/llama-parse-cli/cmd/llp@latestllp 会从环境里读取 LLAMA_CLOUD_API_KEY(也可用 --api-key 传入)。
后面几步的分析用到 pandas(仅 Python)—— 每种语言都能解析这份图表 PDF 并取出表格;只有 DataFrame 那部分是 Python 专有。
2. 开启专门的图表解析
专门的图表解析 会让 Parse 以更高保真度抽取 chart 与 graph 的数据。通过 processing_options 开启它,并请求 items 视图,这样就能拿到逐页的结构化表格(以及图形)。
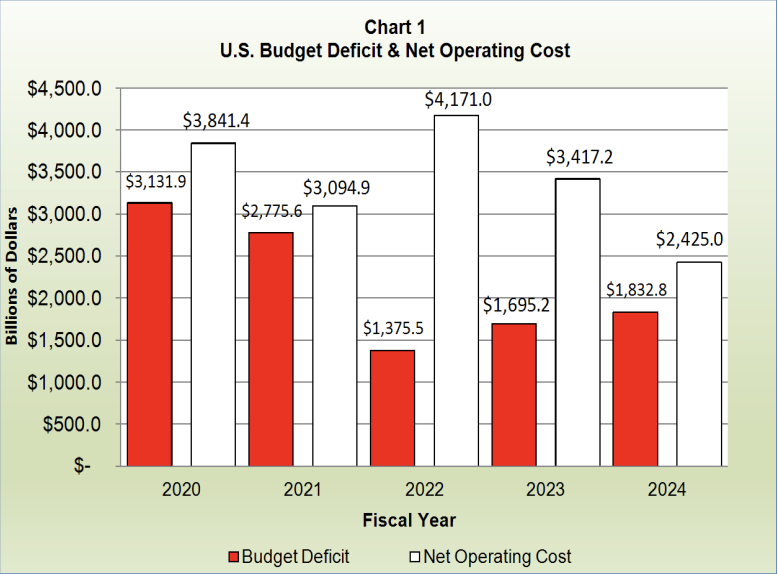
我们解析同一份执行摘要 PDF 并请求 items,以便从第 3 页取出表格 —— 那页包含下面这张图:
在 Python 与 TypeScript 里,expand 是传给解析调用的参数。而在 Go、Java 与 CLI 里,expand 是取结果时的查询参数,因此那几种做法是先创建任务、轮询到终态,再请求 items 视图。
下载这份报告:
终端窗口
curl -fL -o executive-summary-2024.pdf https://fiscal.treasury.gov/system/files/files/reports-statements/financial-report/2024/executive-summary-2024.pdf- Python
- TypeScript
- Go
- Java
- CLI
# Upload the file
file = client.files.create(file="./executive-summary-2024.pdf", purpose="parse")

# Parse with specialized chart parsing, and request the items view
result = client.parsing.parse(
    file_id=file.id,
    tier="agentic_plus",
    version="latest",
    processing_options={"specialized_chart_parsing": "agentic_plus"},
    expand=["items"],
)// Upload the file
const file = await client.files.create({
file: fs.createReadStream('./executive-summary-2024.pdf'),
purpose: 'parse',
});
// Parse with specialized chart parsing, and request the items view
const result = await client.parsing.parse({
file_id: file.id,
tier: 'agentic_plus',
version: 'latest',
processing_options: { specialized_chart_parsing: 'agentic_plus' },
expand: ['items'],
});// Upload the file
f, err := os.Open("./executive-summary-2024.pdf")
if err != nil {
log.Fatal(err)
}
defer f.Close()
file, err := client.Files.New(ctx, llamacloud.FileNewParams{File: f, Purpose: "parse"})
if err != nil {
log.Fatal(err)
}
// Parse with specialized chart parsing (expand is a GET parameter in Go)
job, err := client.Parsing.New(ctx, llamacloud.ParsingNewParams{
FileID: llamacloud.String(file.ID),
Tier: llamacloud.ParsingNewParamsTierAgenticPlus,
Version: llamacloud.ParsingNewParamsVersionLatest,
ProcessingOptions: llamacloud.ParsingNewParamsProcessingOptions{
SpecializedChartParsing: "agentic_plus",
},
})
if err != nil {
log.Fatal(err)
}
// Poll until the job reaches a terminal status, then request the items view
getParams := llamacloud.ParsingGetParams{Expand: []string{"items"}}
result, err := client.Parsing.Get(ctx, job.ID, getParams)
if err != nil {
log.Fatal(err)
}
for result.Job.Status != "COMPLETED" && result.Job.Status != "FAILED" && result.Job.Status != "CANCELLED" {
time.Sleep(2 * time.Second)
result, err = client.Parsing.Get(ctx, job.ID, getParams)
if err != nil {
log.Fatal(err)
}
}
if result.Job.Status != "COMPLETED" {
log.Fatalf("parse ended as %s", result.Job.Status)
}// Upload the file
FileCreateResponse file = client.files().create(FileCreateParams.builder()
.file(Paths.get("./executive-summary-2024.pdf"))
.purpose("parse")
.build());
// Parse with specialized chart parsing (expand is a query parameter in Java)
ParsingCreateResponse job = client.parsing().create(ParsingCreateParams.builder()
.fileId(file.id())
.tier(ParsingCreateParams.Tier.AGENTIC_PLUS)
.version(ParsingCreateParams.Version.LATEST)
.processingOptions(ParsingCreateParams.ProcessingOptions.builder()
.specializedChartParsing(
ParsingCreateParams.ProcessingOptions.SpecializedChartParsing.AGENTIC_PLUS)
.build())
.build());
// Poll until the job reaches a terminal status, then request the items view
ParsingGetParams getParams = ParsingGetParams.builder()
.jobId(job.id())
.addExpand("items")
.build();
ParsingGetResponse result = client.parsing().get(getParams);
while (!result.job().status().equals(ParsingGetResponse.Job.Status.COMPLETED)
&& !result.job().status().equals(ParsingGetResponse.Job.Status.FAILED)
&& !result.job().status().equals(ParsingGetResponse.Job.Status.CANCELLED)) {
Thread.sleep(2000);
result = client.parsing().get(getParams);
}
if (!result.job().status().equals(ParsingGetResponse.Job.Status.COMPLETED)) {
throw new RuntimeException("parse ended as " + result.job().status());
}终端窗口
# Upload the file
FILE_ID=$(llp files create \
  --file ./executive-summary-2024.pdf \
  --purpose parse | jq -r '.id')

# Parse with specialized chart parsing
JOB_ID=$(llp parsing create \
  --file-id "$FILE_ID" \
  --tier agentic_plus \
  --version latest \
  --processing-options.specialized-chart-parsing agentic_plus \
  | jq -r '.id')

# Poll until the job reaches a terminal status
while true; do
  STATUS=$(llp parsing get --job-id "$JOB_ID" | jq -er '.job.status') || break
  case "$STATUS" in COMPLETED|FAILED|CANCELLED) break ;; esac
  sleep 2
done3. 取第 3 页的表格数据
PDF 的第三页(在 items 树里索引为 2)含有一张图表。开启图表解析后,Parse 通常会把图表的数据表示成 items 树里的一个 table。我们收集该页的第一张表,并用它的 rows 做后续分析。
- Python
- TypeScript
- Go
- Java
- CLI
page_three = result.items.pages[2]  # third page (0-indexed)

tables = [item for item in page_three.items if getattr(item, "type", None) == "table"]
if not tables:
    raise ValueError("No table found on page 3. Try the agentic_plus tier.")

rows = tables[0].rows
print(f"Chart table has {len(rows)} rows")const pageThree = result.items.pages[2]; // third page (0-indexed)
let rows;
for (const item of pageThree.items) {
if ('type' in item && item.type === 'table' && 'rows' in item) {
rows = item.rows;
break;
}
}
if (!rows) {
throw new Error('No table found on page 3. Try the agentic_plus tier.');
}
console.log(`Chart table has ${rows.length} rows`);page := result.Items.Pages[2] // third page (0-indexed)
var rows [][]*llamacloud.TableItemRowUnion
for _, item := range page.Items {
if item.Type == "table" {
rows = item.Rows
break
}
}
if rows == nil {
log.Fatal("No table found on page 3. Try the agentic_plus tier.")
}
fmt.Printf("Chart table has %d rows\n", len(rows))ParsingGetResponse.Items.Page page = result.items().get().pages().get(2); // third page (0-indexed)
if (!page.isStructuredResult()) {
throw new RuntimeException("No table found on page 3. Try the agentic_plus tier.");
}
ParsingGetResponse.Items.Page.StructuredResultPage pageThree = page.asStructuredResult();
var rows = pageThree.items().stream()
.filter(ParsingGetResponse.Items.Page.StructuredResultPage.Item::isTable)
.findFirst()
.orElseThrow(() -> new RuntimeException("No table found on page 3. Try the agentic_plus tier."))
.asTable()
.rows();
System.out.println("Chart table has " + rows.size() + " rows");终端窗口
# Pull the rows of the first table on page 3 (index 2)
llp parsing get --job-id "$JOB_ID" --expand items \
  | jq -r 'if .job.status == "COMPLETED" then .items.pages[2].items | map(select(.type == "table"))[0].rows
else "Parse job failed: \(.job.error_message // .)" end'4. 把财年图表载入 pandas
下面的分析使用 Python + pandas。这一页的图表是一张分组柱状图,展示 2020–2024 各财年的 Budget Deficit(预算赤字)与 Net Operating Cost(净运营成本),单位均为十亿美元。我们把它的表格整理成一个干净的时间序列 DataFrame:
import pandas as pd

# First row as column names, rest as data
header = rows[0]
df = pd.DataFrame(rows[1:], columns=header)

money_cols = [
    "Budget Deficit (Billions of Dollars)",
    "Net Operating Cost (Billions of Dollars)",
]

df["Fiscal Year"] = df["Fiscal Year"].astype(int)

print("DataFrame:")
print(df)DataFrame:
Fiscal Year Budget Deficit (Billions of Dollars) \
0 2020 $3,131.9
1 2021 $2,775.6
2 2022 $1,375.5
3 2023 $1,695.2
4 2024 $1,832.8
Net Operating Cost (Billions of Dollars)
0 $3,841.4
1 $3,094.9
2 $4,171.0
3 $3,417.2
4 $2,425.05. 分析赤字与净运营成本的差异
数据整理干净后,我们就能复现图表文字部分描述的那几层关键关系。
1. 两个序列的逐年的变化
df["Deficit YoY Change"] = df["Budget Deficit (Billions of Dollars)"].diff()
df["Net Operating Cost YoY Change"] = df["Net Operating Cost (Billions of Dollars)"].diff()

print(df[["Fiscal Year",
          "Budget Deficit (Billions of Dollars)",
          "Net Operating Cost (Billions of Dollars)",
          "Deficit YoY Change",
"Net Operating Cost YoY Change"]]) Fiscal Year Budget Deficit (Billions of Dollars) \
0 2020 3131.9
1 2021 2775.6
2 2022 1375.5
3 2023 1695.2
4 2024 1832.8
Net Operating Cost (Billions of Dollars) Deficit YoY Change \
0 3841.4 NaN
1 3094.9 -356.3
2 4171.0 -1400.1
3 3417.2 319.7
4 2425.0 137.6
Net Operating Cost YoY Change
0 NaN
1 -746.5
2 1076.1
3 -753.8这会凸显出例如 2022 年净运营成本的急剧上升,以及 2023–2024 的回落。
2. 净运营成本与预算赤字之间的差值
df["Gap (Net Operating Cost - Deficit)"] = (
    df["Net Operating Cost (Billions of Dollars)"]
    - df["Budget Deficit (Billions of Dollars)"]
)

print("\nGap between Net Operating Cost and Budget Deficit (billions):")
print(df[["Fiscal Year", "Gap (Net Operating Cost - Deficit)"]])

print("\nYear with largest gap:")
print(df.loc[df["Gap (Net Operating Cost - Deficit)"].idxmax()])

print("\nYear with smallest gap:")
print(df.loc[df["Gap (Net Operating Cost - Deficit)"].idxmin()])Gap between Net Operating Cost and Budget Deficit (billions):
Fiscal Year Gap (Net Operating Cost - Deficit)
0 2020 709.5
1 2021 319.3
2 2022 2795.5
3 2023 1722.0
4 2024 592.2
Year with largest gap:
Fiscal Year 2022.0
Budget Deficit (Billions of Dollars) 1375.5
Net Operating Cost (Billions of Dollars) 4171.0
Deficit YoY Change -1400.1
Net Operating Cost YoY Change 1076.1
Gap (Net Operating Cost - Deficit) 2795.5
Name: 2, dtype: float64
Year with smallest gap:
Fiscal Year 2021.0
Budget Deficit (Billions of Dollars) 2775.6
Net Operating Cost (Billions of Dollars) 3094.9
Deficit YoY Change -356.3
Net Operating Cost YoY Change -746.5
Gap (Net Operating Cost - Deficit) 319.3
Name: 1, dtype: float64这会复现那段叙述:2022 年两个指标的分歧最大,而到了 2024 年差距已明显收窄。
3. 快速可视化(可选)
ax = df.plot(
    x="Fiscal Year",
    y=[
        "Budget Deficit (Billions of Dollars)",
        "Net Operating Cost (Billions of Dollars)",
    ],
    kind="bar",
    title="U.S. Budget Deficit & Net Operating Cost (Billions of Dollars)",
)
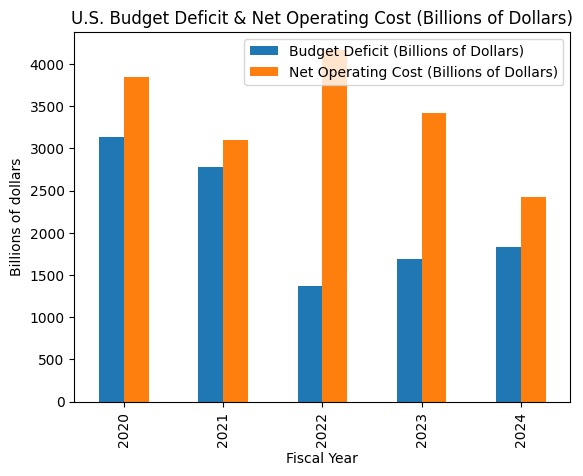
ax.set_ylabel("Billions of dollars")这张柱状图与 PDF 里的 Chart 1 高度一致,但如今背后是一个 DataFrame,你可以继续切片、聚合或喂给下游分析。
总结
- PDF 里有图表想变成结构化数据时,用专门的图表解析(
processing_options.specialized_chart_parsing:"agentic"或"agentic_plus")。 - 在
expand里请求 items,以拿到逐页的表格(与图形)。 - 从含图表的那页(这里是第 3 页)取出 表格行,用
rows搭一个 pandas DataFrame,再按需做汇总、绘图或筛选。
更多选项(例如 efficient 与 agentic 的差别)见专门的图表解析。