主题
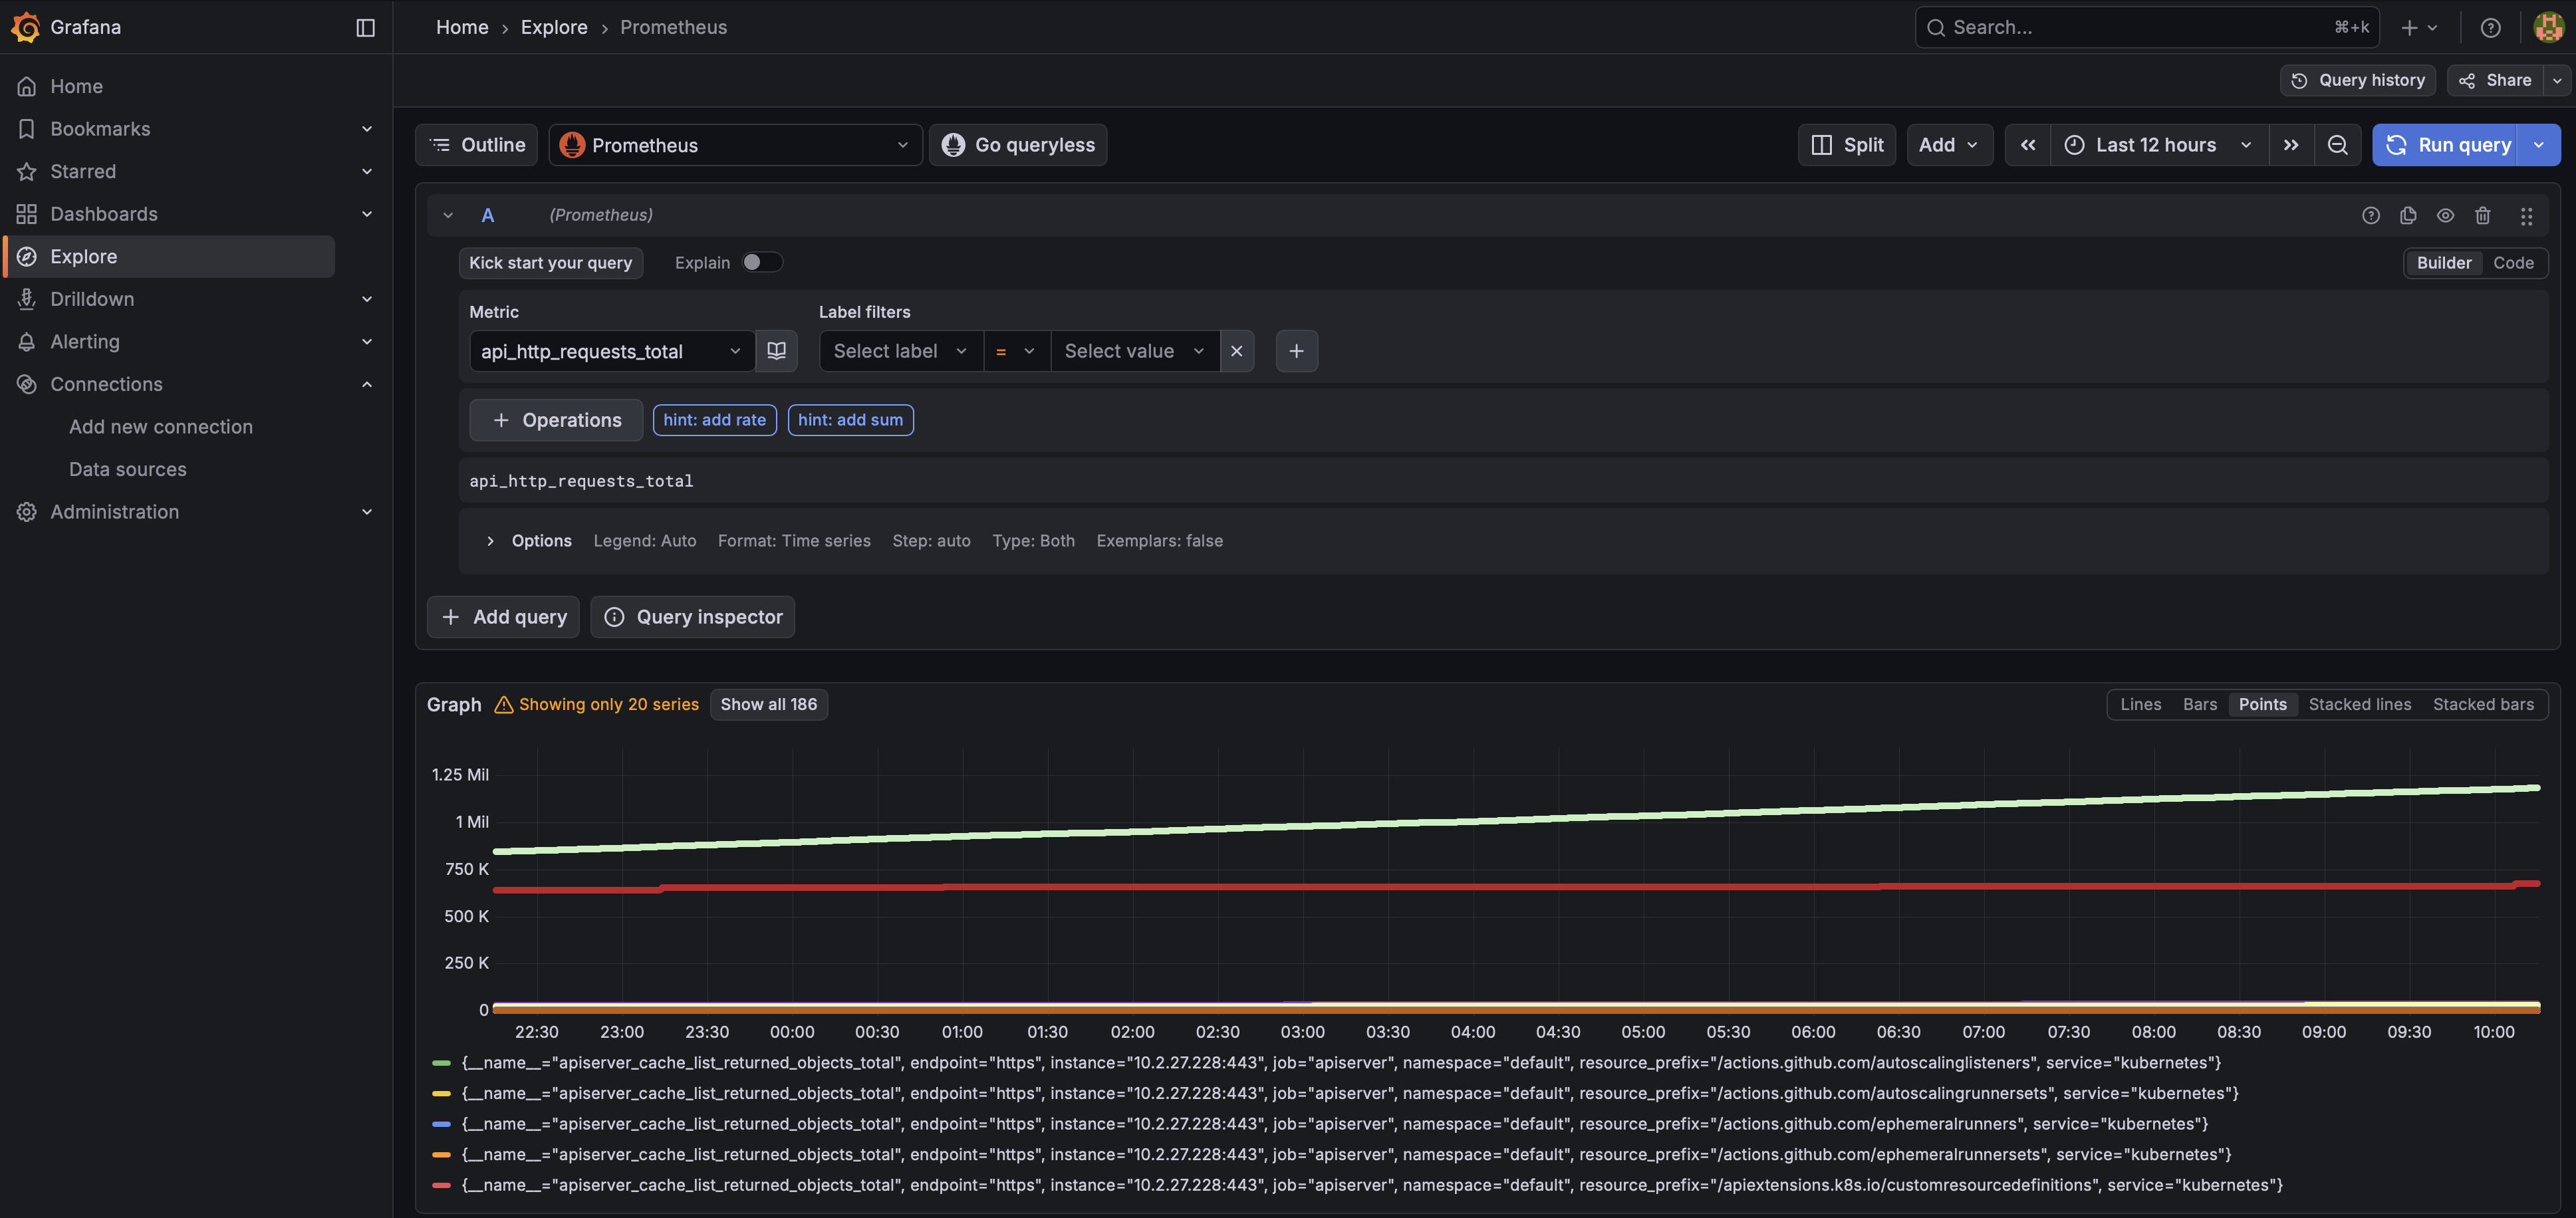
LlamaCloud 的各服务都会暴露指标,由 Prometheus 采集,并在 Grafana 中可视化。
前置条件
要监控你的 LlamaCloud 部署,你需要:
- Prometheus —— 指标的采集与存储
- Grafana —— 指标的可视化
- AlertManager —— 告警管理
这些服务都可以用 kube-prometheus-stack 这个 Helm chart 部署,它提供一套完整的监控方案,包含:
- 用于指标采集的 Prometheus server
- 用于可视化的 Grafana,并预置了仪表盘
- 用于处理告警的 AlertManager
- 用于硬件与操作系统指标的 Node exporter
- 用于 Kubernetes 对象指标的 kube-state-metrics
- 用于管理 Prometheus 实例的 Prometheus Operator
把这份文件当作一次基础安装的起点:
kube-prometheus-stack.yaml
prometheus:
  enabled: true
grafana:
  enabled: true
alertmanager:
enabled: true终端窗口
helm repo add prometheus-community https://prometheus-community.github.io/helm-charts
helm repo update
helm install kube-prometheus-stack prometheus-community/kube-prometheus-stack \
-f kube-prometheus-stack.yaml关于 kube-prometheus-stack 这个 Helm chart 的更多信息,请参阅 kube-prometheus-stack README。
服务监控
装好 kube-prometheus-stack 这个 Helm chart 之后,你应当创建 ServiceMonitor 对象。这些对象告诉 Prometheus 去抓取 LlamaCloud 各服务暴露的指标端点。
- LlamaCloud
- JobsService
- LlamaParseOcr
apiVersion: monitoring.coreos.com/v1
kind: ServiceMonitor
metadata:
  # 👇 The name of the service you want to monitor.
  name: llamacloud
  # 👇 The namespace where the ServiceMonitor object lives; typically the namespace where you installed the chart.
  namespace: <kube-prometheus-stack-namespace>
  labels:
    # 👇 Typically this is the same namespace as above.
    release: kube-prometheus-stack
spec:
  namespaceSelector:
    matchNames:
      # 👇 The namespace you installed Llamacloud into.
      - <llamacloud-namespace>
  selector:
    matchLabels:
      app.kubernetes.io/instance: llamacloud
      app.kubernetes.io/name: llamacloud
      app.kubernetes.io/managed-by: Helm
  endpoints:
    - port: http
      path: /metrics
      interval: 30s
scrapeTimeout: 10sapiVersion: monitoring.coreos.com/v1
kind: ServiceMonitor
metadata:
# 👇 The name of the service you want to monitor.
name: llamacloud-operator
# 👇 The namespace where the ServiceMonitor object lives; typically the namespace where you installed the chart.
namespace: <kube-prometheus-stack-namespace>
labels:
# 👇 Typically this is the same namespace as above.
release: kube-prometheus-stack
spec:
namespaceSelector:
matchNames:
# 👇 The namespace you installed Llamacloud into.
- <llamacloud-namespace>
selector:
matchLabels:
app.kubernetes.io/instance: llamacloud
app.kubernetes.io/name: llamacloud-operator
app.kubernetes.io/managed-by: Helm
endpoints:
- port: http
path: /metrics
interval: 30s
scrapeTimeout: 10sapiVersion: monitoring.coreos.com/v1
kind: ServiceMonitor
metadata:
# 👇 The name of the service you want to monitor.
name: llamacloud-ocr
# 👇 The namespace where the ServiceMonitor object lives; typically the namespace where you installed the chart.
namespace: <kube-prometheus-stack-namespace>
labels:
# 👇 Typically this is the same namespace as above.
release: kube-prometheus-stack
spec:
namespaceSelector:
matchNames:
# 👇 The namespace you installed Llamacloud into.
- <llamacloud-namespace>
selector:
matchLabels:
app.kubernetes.io/instance: llamacloud
app.kubernetes.io/name: llamacloud-ocr
app.kubernetes.io/managed-by: Helm
endpoints:
- port: http
path: /metrics
interval: 30s
scrapeTimeout: 10sGrafana
装好 kube-prometheus-stack 并把 ServiceMonitor 对象装进你的 Kubernetes 集群后,你就能在 Grafana 里查看这些指标。
先取到 Grafana admin 用户的密码:
终端窗口
kubectl --namespace <llamacloud-namespace> get secrets kube-prometheus-stack-grafana -o jsonpath="{.data.admin-password}" | base64 -d ; echo接着为 Grafana 建一个 port-forward:
终端窗口
export GRAFANA_POD_NAME=$(kubectl --namespace <llamacloud-namespace> \
    get pod -l "app.kubernetes.io/name=grafana,app.kubernetes.io/instance=kube-prometheus-stack" -oname)
kubectl --namespace <llamacloud-namespace> port-forward $GRAFANA_POD_NAME 3000然后在浏览器打开 localhost:3000 登录 Grafana 控制台。你就能在 Explore 标签里浏览全部 LlamaCloud 指标。